There's been a lot of speculation on the internet that a market correction is on the way, and I tend to agree.
To show why, I've created a very brief indroduction to two of the charts that I generate continuously during
the day. I also have the capacity to generate historical charts, which means that I can show how these charts
looked at the start of the corrections of 2001, 2007, 2010 and 2011. Comparing the historical charts with
today's chart gives me the feeling that a correction is near, but it's not here yet.
I generate what I call Adaptive Price Channel charts, or APC charts, and I find that I can derive a great
deal of information from these charts. I can generate intraday charts (90 minute, 60 minute, 45 minute, etc.),
as well as daily, weekly and monthly charts. I find that it can be quite helpful to overlay different time
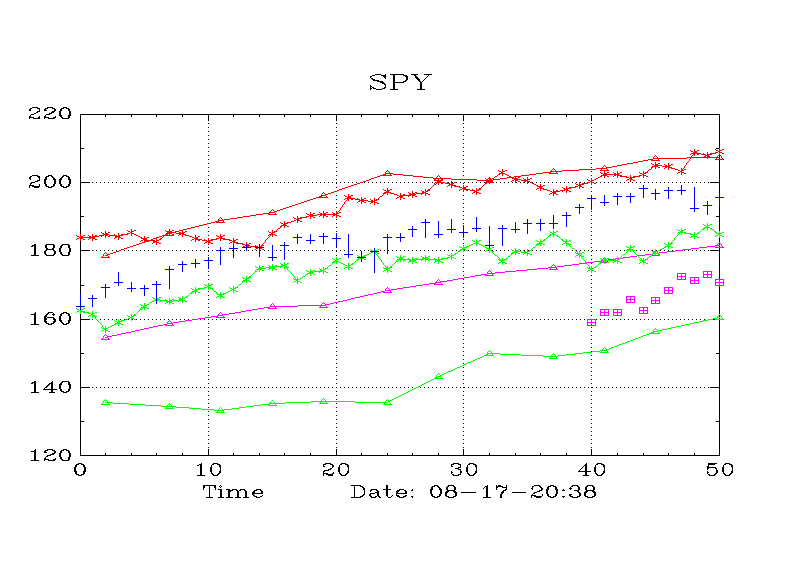
frequencies on top of each other. This first chart is an example of that. It's a weekly chart, which means
that each tick represents one week of market activity. The chart shows both the Monthly APC Channel (with
triangles on it), and the Weekly APC Channel (with asteriscs on it). This means that the Monthly APC channel
has been overlayed on top of the weekly price chart and on top of the weekly APC channel.
The security being charted is SPY, or
"Spyders." This is an ETF (a mutual fund), which mimics the behavior of the S&P 500. At any given time,
the value of this ETF is approximately the value of the S&P 500 divided by 10.
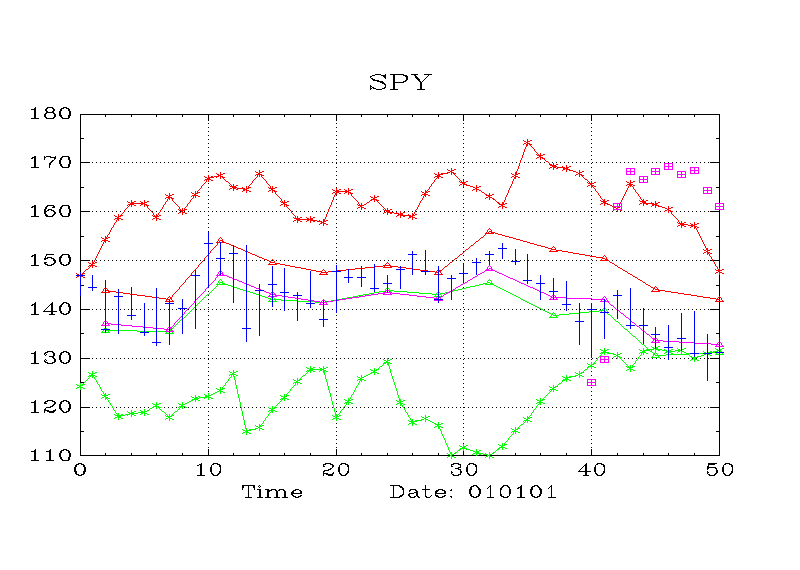
Notice that the price ticks push above the monthly upper channel at ticks 10, 16, and 17. This seems to be
an excellent indication that price will soon correct downward on the weekly chart (and all other charts too).
Notice also that the monthly APC channel is much narrower than the weekly APC channel. This means that the
correction will be quite severe. In fact, this will be not merely a correction, but it will be the beginning
of a bear market. The fact that price falls below the monthly channel at ticks 12, 13, 14, 17 and 19 does
not seem to be particularly relevant. It simply emphasizes the fact that the monthly channel is very narrow.
This first chart shows the end of the .com bull market and the beginning of the 2001 bear market.
Chart 1 (2001 Correction)
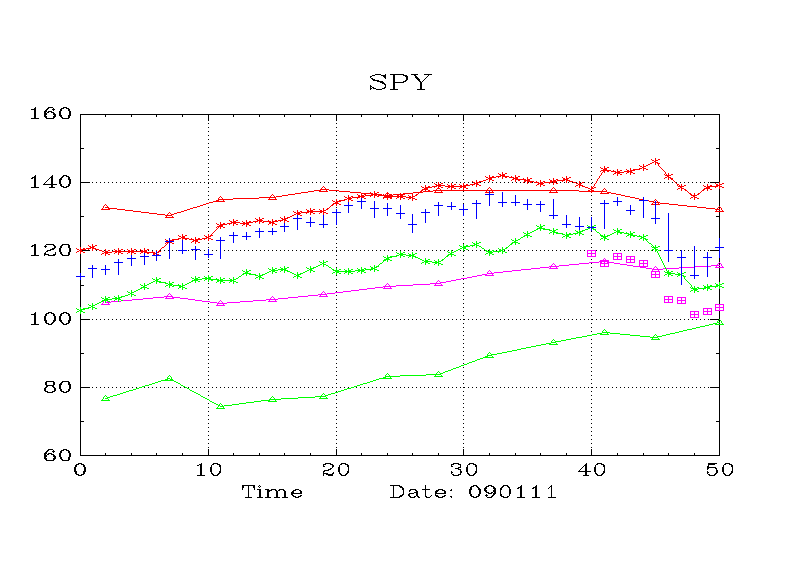
Moving on now to the correction of 2007. Chart 2 shows that once again in 2007, the monthly APC channel is
noticeably narrower than the weekly APC channel. So when price pushes above the monthly chart at ticks
28 through 36 and 47, the ensuing correction will in fact be a bear market. We all recall that this bear
market climaxed in 2008 with the failing of the Lehman Brothers and Bear Stearns investment banks.
Chart 2 (2007 Correction)
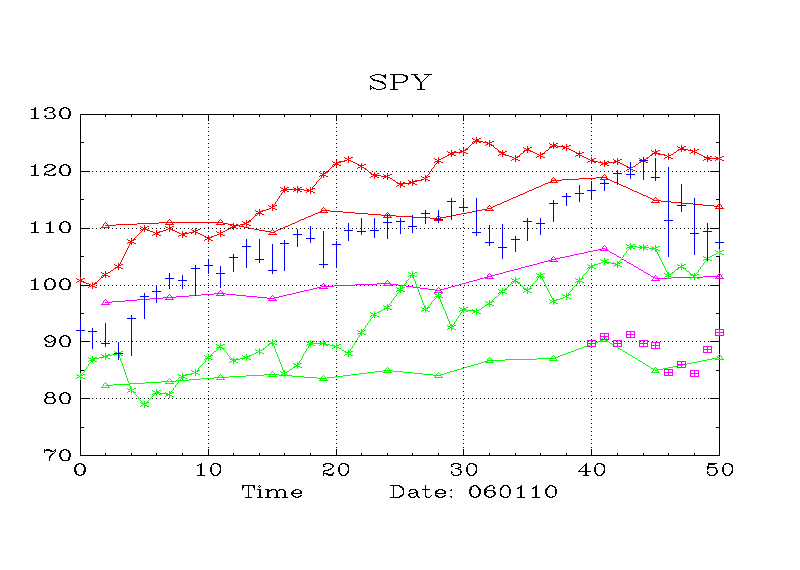
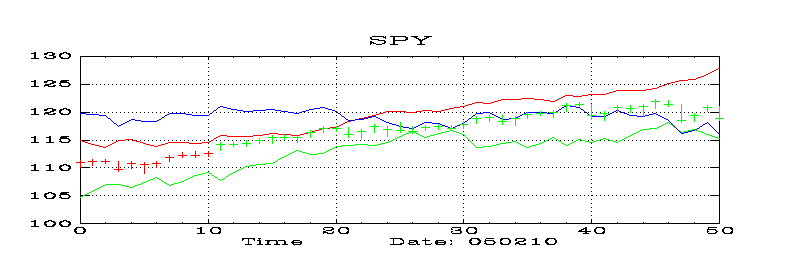
Now let's look at some smaller corrections. The correction of 2010 was a medium sized (approximately 8 week)
correction during a bull market. Because it was not the start of a bear market, the width of the monthly
channel is a bit greater than the width of the weekly channel. Chart 3 shows this correction, and
like all weekly corrections, it begins with one or more places where price exceeds the upper edge of the
monthly channel. This happens at ticks 29, 30, 42, 43, 44 and 45.
Chart 3 (2010 Correction)
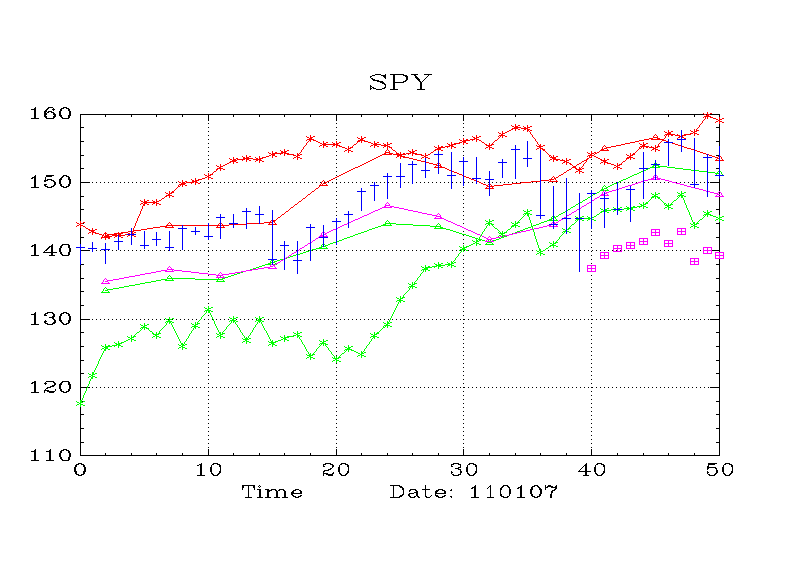
Now let's look at the correction of 2011. Here again, the hallmark of a correction on the weekly chart, is
that it touches and sometimes exceeds the upper edge of the monthly APC channel. Chart 4 shows this correction.
At ticks 32 and 44, the monthly APC channel is violated. In 2011, the bull market was in full swing, so the
weekly APC channel was quite a bit narrower than the monthly APC channel.
Chart 4 (2011 Correction)
Finally, let's look at today's chart. Chart 5 shows that the bull market is well under way, because the
width of the weekly APC channel is quite a bit narrower than the width of the monthly APC channel. The
weekly price ticks are clearly moving up, but they have not yet collided with the upper edge of the
monthly APC channel. It appears that when the price of SPY (an ETF proxy for the S&P 500) exceeds 205,
that will probably mark the beginning of a typical 8 week correction.
Chart 5 (2014 Correction ?)
I have some further evidence that the correction has not yet begun. The following three charts are all
daily charts. This means that each tick represents one day of market activity.
Let's go back to the correction of 2010. Chart 6 shows the daily APC channel, as well as a blue line, that
indicates the direction that the market will likely follow in the coming ticks. You can see the indication
by comparing whether the blue line at tick 50 is higher or lower than the price tick. Notice that in 2010, the
blue line is indicating fairly clearly, that price will continue down.
Chart 6 (2010 Correction)
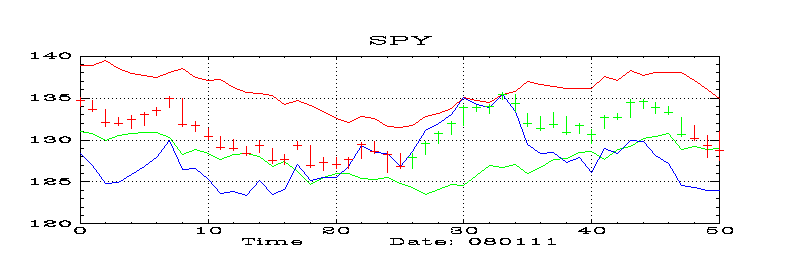
Looking now at the correction of 2011, Chart 7 shows even more clearly than Chart 6, that price will continue
down. You should ignore the positioning of the blue line in the first 2/3rds of the chart. The important
part of the chart is just the last 4 or 5 ticks.
Chart 7 (2011 Correction)
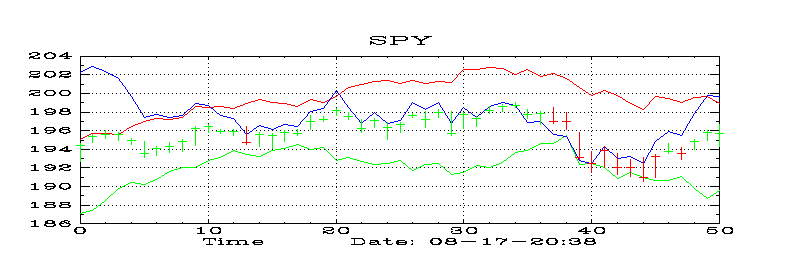
And last but not least, let's look at today's daily chart for SPY.
The blue line at tick 50 is quite a bit higher the price tick.
So it's likely that the move up has not yet ended.